
In the AIAG-VDA methodology, the Occurrence in Failure Modes and Effects Analysis (FMEA) rating helps in evaluating risk by measuring how a specific cause of failure is to happen. It focuses on the frequency of the failure cause.
This article explains every detail about occurrence rating in FMEA with practical examples.
Let’s dive in.
What is Occurrence in FMEA and Why It Matters? #
In Failure Mode and Effects Analysis (FMEA), the Occurrence rating measures how frequently a failure cause is likely to occur in a product or process.
It answers the key question:
“How often can this cause of failure happen under current conditions?”
Understanding Occurrence helps quality engineers:
- Prioritize risks based on frequency of failure happening
- Identify prevention controls
- Take improvement actions that actually reduce failure count
- Meet OEM/customer expectations for good risk analysis (especially as per AIAG-VDA)
Let’s understand this more using the AIAG-VDA 7-step method and practical automotive examples.
Concept of Occurrence in AIAG-VDA FMEA #
The AIAG-VDA FMEA Handbook (1st Edition) standardizes Occurrence evaluation criteria across DFMEA, PFMEA, and FMEA-MSR.
Occurrence Definition:
“The likelihood that a specific cause/mechanism of failure will occur and result in the failure mode.”
It’s not about the severity of the failure, but how frequently the cause happens under existing controls.
FMEA Step Alignment: Where Occurrence Comes in the 7-Step Approach #
In the AIAG-VDA 7-Step FMEA process, Occurrence is addressed in:
- Step 5: Risk Analysis
➤ Here, the team identifies preventive and detection measures and assigns Severity, Occurrence, and Detection ratings. - Step 6: Optimization
➤ Actions are defined to reduce the occurrence (by improving prevention controls) if risks are high.
Occurrence Rating Table (DFMEA vs PFMEA) #
You will see the Design FMEA and Process FMEA occurrence table below with correct criteria.
DFMEA – Design FMEA Occurrence Rating Table (AIAG-VDA)
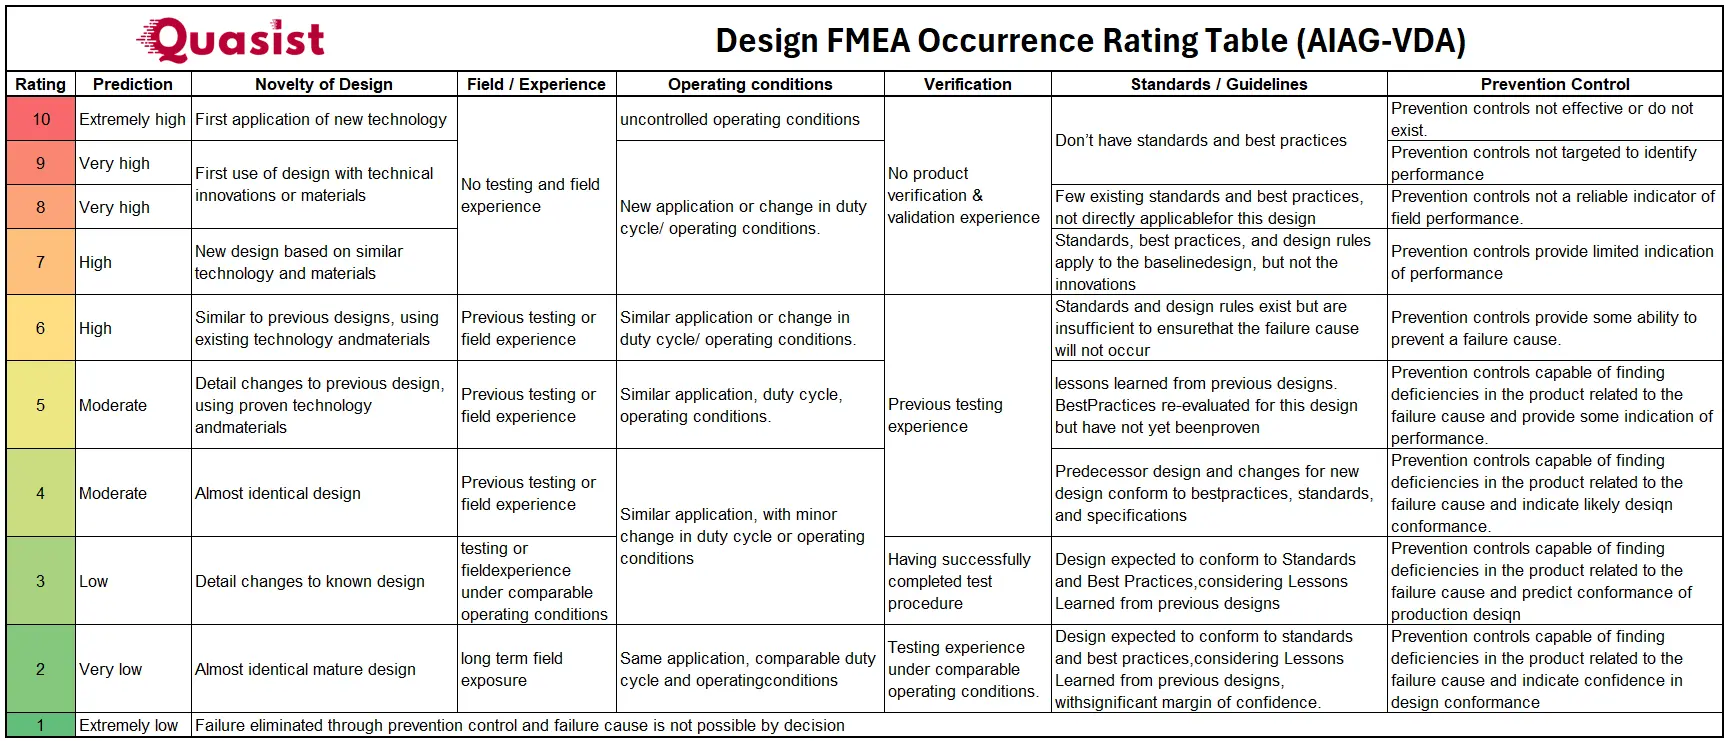
| Rating | Prediction | Occurrence criteria – DFMEA |
|---|---|---|
| 10 | Extremely high | First application of new technology anywhere without operatingexperience and/or under uncontrolled operating conditions. Noproduct verification and/or validation experience. Standards do not exist and best practices have not yet beendetermined. Prevention controls not able to predict fieldperformance or do not exist. |
| 9 | Very high | First use of design with technical innovations or materials withinthe company. New application or change in duty cycle / operating conditions. No product verification and/or validation experience. Prevention controls not targeted to identify performance to specific requirements. |
| 8 | Very high | First use of design with technical innovations or materials on anew application. New application or change in duty cycle/operating conditions. No product verification and/or validation experience. Few existing standards and best practices, not directly applicablefor this design. Prevention controls not a reliable indicator of fieldperformance. |
| 7 | High | New design based on similar technology and materials. Newapplication or change in duty cycle / operating conditions. Noproduct verification and/or validation experience. Standards, best practices, and design rules apply to the baselinedesign, but not the innovations. Prevention controls provide limited indication of performance. |
| 6 | High | Similar to previous designs, using existing technology andmaterials. Similar application, with changes in duty cycle oroperating conditions. Previous testing or field experience. Standards and design rules exist but are insufficient to ensurethat the failure cause will not occur. Prevention controls providesome ability to prevent a failure cause. |
| 5 | Moderate | Detail changes to previous design, using proven technology andmaterials. Similar application, duty cycle or operating conditions.Previous testing or field experience, or new design with some testexperience related to the failure. Design addresses lessons learned from previous designs. BestPractices re-evaluated for this design but have not yet beenproven. Prevention controls capable of finding deficiencies in the product related to the failure cause and provide some indication of performance. |
| 4 | Moderate | Almost identical design with short-term field exposure. Similarapplication, with minor change in duty cycle or operatingconditions. Previous testing or field experience. Predecessor design and changes for new design conform to bestpractices, standards, and specifications. Prevention controlscapable of finding deficiencies in the product related to the failurecause and indicate likely desiqn conformance. |
| 3 | Low | Detail changes to known design (same application, with minorchange in duty cycle or operating conditions) and testing or fieldexperience under comparable operating conditions, or newdesign with successfully completed test procedure. Design expected to conform to Standards and Best Practices,considering Lessons Learned from previous designs. Preventioncontrols capable of finding deficiencies in the product related tothe failure cause and predict conformance of production design. |
| 2 | Very Low | Almost identical mature design with long term field exposure.Same application, with comparable duty cycle and operatingconditions. Testing or field experience under comparableoperating conditions. Design expected to conform to standards and best practices,considering Lessons Learned from previous designs, withsignificant margin of confidence. Prevention controls capable offinding deficiencies in the product related to the failure cause andindicate confidence in design conformance. |
| 1 | Extremely low | Failure eliminated through prevention control and failure cause isnot possible by design. |
PFMEA – Process FMEA Occurrence Rating (AIAG-VDA)
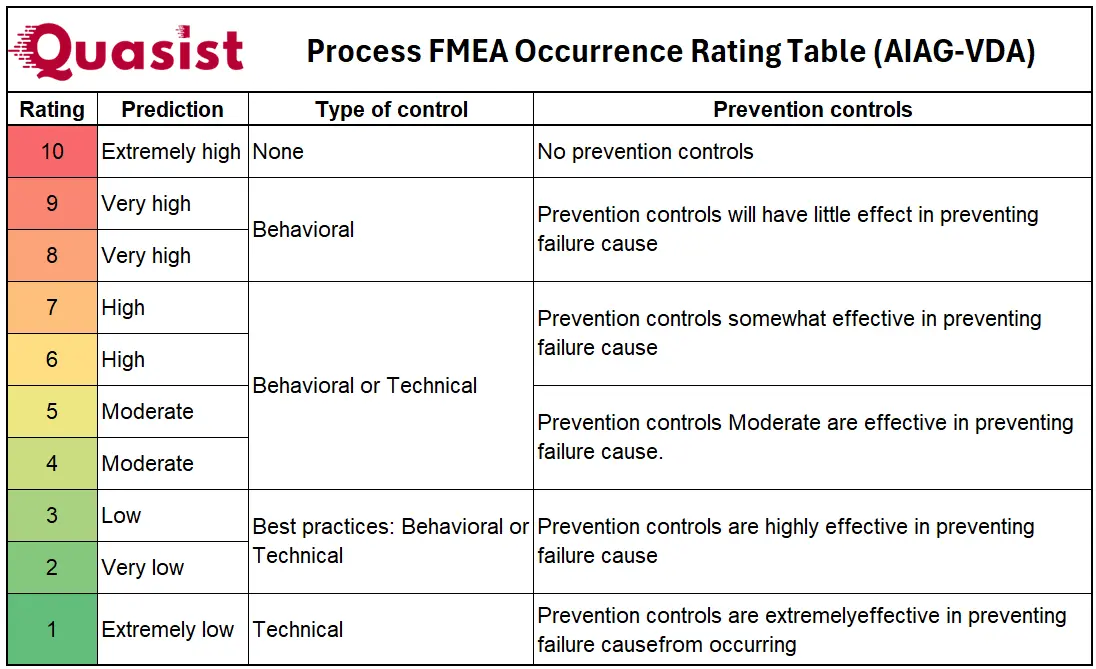
| Rating | Prediction | Type of control | Prevention controls |
|---|---|---|---|
| 10 | Extremely high | None | No prevention controls |
| 9 | Very high | Behavioral | Prevention controls will have little effect in preventing failure cause |
| 8 | Very high | ||
| 7 | High | Behavioral or Technical | Prevention controls somewhat effective in preventing failure cause |
| 6 | High | ||
| 5 | Moderate | Prevention controls Moderate are effective in preventing failure cause. | |
| 4 | Moderate | ||
| 3 | Low | Best practices: Behavioral or Technical | Prevention controls are highly effective in preventing failure cause |
| 2 | Very low | ||
| 1 | Extremely low | Technical | Prevention controls are extremelyeffective in preventing failure causefrom occurring |
Note: Actual data (field returns, test results, SPC, etc.) should support rating decisions whenever possible.
How to Reduce Occurrence in FMEA (AIAG-VDA Approach) #
1. Improve Prevention Controls
Occurrence is directly affected by the effectiveness of current prevention controls. These controls should prevent the cause from happening.
Examples:
- Switch from manual assembly to automated error-proofing
- Use design simulations (FEA, thermal, fatigue) to validate design.
- Apply robust design principles (e.g., design for Six Sigma) early in development
- Add checklists, design guidelines, and standardized rules proven to prevent similar failures
2. Implement Error-Proofing (Poka-Yoke)
In PFMEA, one of the most effective ways to reduce Occurrence is by using mechanical, electrical, or software-based Poka-Yoke that physically prevents the cause from happening.
Example:
- Prevent missing bolt tightening by using a smart torque tool that locks until correct torque is achieved.
3. Use Proven or Mature Designs
When possible, depend on:
- Carryover components with strong performance history
- Standardized, tested subsystems
- Long-term field data to support design reuse
The more mature and validated the design or process is, the lower the Occurrence rating, as shown in the AIAG-VDA occurrence table.
4. Gather and Use Real-World Data
Use historical data to understand and eliminate frequent causes:
- SPC trends
- Field returns and warranty claims
- Test failures and process audits
- 8D/CAPA root causes
Then design specific preventive actions to eliminate root causes.
5. Enhance Material or Process Capability
Reducing variation can reduce the chances of failure causes.
Examples:
- Switch from ±0.2 mm tolerance part to a precision-machined ±0.05 mm part
- Upgrade process capability from Cp 1.0 to Cp 1.67
- Introduce closed-loop process control to maintain consistency
6. Close the action in Optimization (FMEA Step 6)
After defining recommended actions:
- Implement the prevention improvements
- Verify effectiveness (validation testing, capability analysis)
- Re-evaluate Occurrence rating
- Document the updated rating in FMEA
Tip: Do not lower Occurrence unless the action has been verified and implemented.
7. Reduced occurrence based on detection action
As per AIAG-VDA standard, Occurrence 10, 9,8, 7 can drop based on product validation activities.
If you have a new innovation product then after completion of detection action you have a good experience with design. Therefore, result of completed detection controls provide you experience with the design and then you can modify occurrence rating accordingly.
Real-World Example of Occurrence Evaluation #
You will see the actual real life example of occurrence given for PFMEA and DFMEA.
DFMEA Occurrence Rating Example: Design of a New Electric Water Pump
Component: Electric Water Pump for EV Cooling System
Failure Mode: Pump fails to start during vehicle operation
Cause: Brushless DC motor winding insulation breakdown
Current Prevention Controls: Design FMEA review, material spec validation, but no long-term field data or simulation of thermal fatigue under aggressive duty cycles
Now let’s walk through the table to determine the Occurrence rating:
| Evaluation Category | Assessment for this case |
|---|---|
| Novelty of Design | First use of new insulation material in motor = matches Rating 8 or 9 |
| Field Exposure | No field data, only lab test validation = Rating 8–9 |
| Operating Conditions | Application in new EV platform with variable load cycles = Rating 8–9 |
| Verification | No complete long-term validation for new insulation = Rating 9 |
| Standards & Guidelines | Existing standards apply partially, not specific to thermal stress in EV context = Rating 8 |
| Prevention Control | Current controls not fully predictive of real-world insulation fatigue = Rating 8–9 |
Final Occurrence Rating: 9
Justification for given occurrence: Now, some validation tests have completed, there’s no long-term field data or simulation under the actual EV duty cycle. Standards are only partially applicable, and the prevention controls do not identify potential field failure. Therefore, the cause has a high likelihood of occurrence.
PFMEA Occurrence Rating Example: Spot Welding Process
- Failure Mode: Poor weld quality
- Failure Cause: Dirty electrode tips
- Prevention Control: Daily tip maintenance checklist
Let’s say the team finds that dirty tips lead to weak welds every 2–3 days in production. Based on historical rework and inspection data:
- Occurrence Rating = 8 (High)
Because this failure happens frequently enough to warrant concern.
But, if the team implements an automated electrode tip cleaner triggered after every 50 welds, and proves that poor welds drop significantly:
- New Occurrence Rating = 3 (Very low)
Due to robust process control and verified improvement.
Common Mistakes in Occurrence Rating #
- Confusing Failure Mode with Failure Cause
Occurrence is for the cause – not the mode itself. - Guessing Without Data
Always base your rating on evidence (warranty data, SPC, rework logs). - Not Updating After Actions
If an action reduces frequency, update the rating during re-evaluation. - Same Occurrence for All Causes
Each cause must be evaluated independently, to avoid copy-pasting ratings.
Best Practices & Expert Tips #
- Use process data, test records, field failure rates to back your rating.
- Differentiate between in-house detection vs customer detection failures.
- Don’t hesitate to assign high Occurrence when the process is not stable, FMEA is a risk tool, not a report card.
- Prioritize causes with high Occurrence and Severity using the Action Priority (AP) table.
Checklist: How to Assign Occurrence Rating Accurately #
- Have we clearly identified the cause of the failure?
- Are this carryover product? Similar to previous one? Or Completely new one.
- Is there historical data or team experience to support the frequency?
- Are prevention controls documented and working?
- Has this issue appeared in the field, line, or test benches?
- Have actions been taken, and was a new rating assigned?
Summary / Key Takeaways #
- Occurrence in FMEA estimates how frequently a cause will result in a failure.
- The rating is based on evidence, not guesswork.
- It’s one leg of the S-O-D triad (Severity-Occurrence-Detection).
- Reducing Occurrence requires strong prevention controls and process improvements.
- Always reassess after implementing actions in Step 6 of the AIAG-VDA FMEA.
No. It’s the expected frequency of a failure cause, which may be caught before reaching the customer.
Certainly not. But if data is missing, use expert judgment and document assumptions.
No. Detection controls reduce Detection rating, not Occurrence. Only prevention actions can reduce occurrences.
Yes, because Occurrence depends on how often a cause happens, regardless of detection efficiency.
There’s no fixed target, but aim for ratings below 4 wherever possible by improving prevention controls.
Yes, the completed detection actions gives you the design or process experience. Based on that you can reduce occurrence rating.


